
It might look overwhelming when you fire up VSCode for the first time. Let me walk you through the GUI so you get the most from this powerful IDE.
Main sections of the VSCode workspace
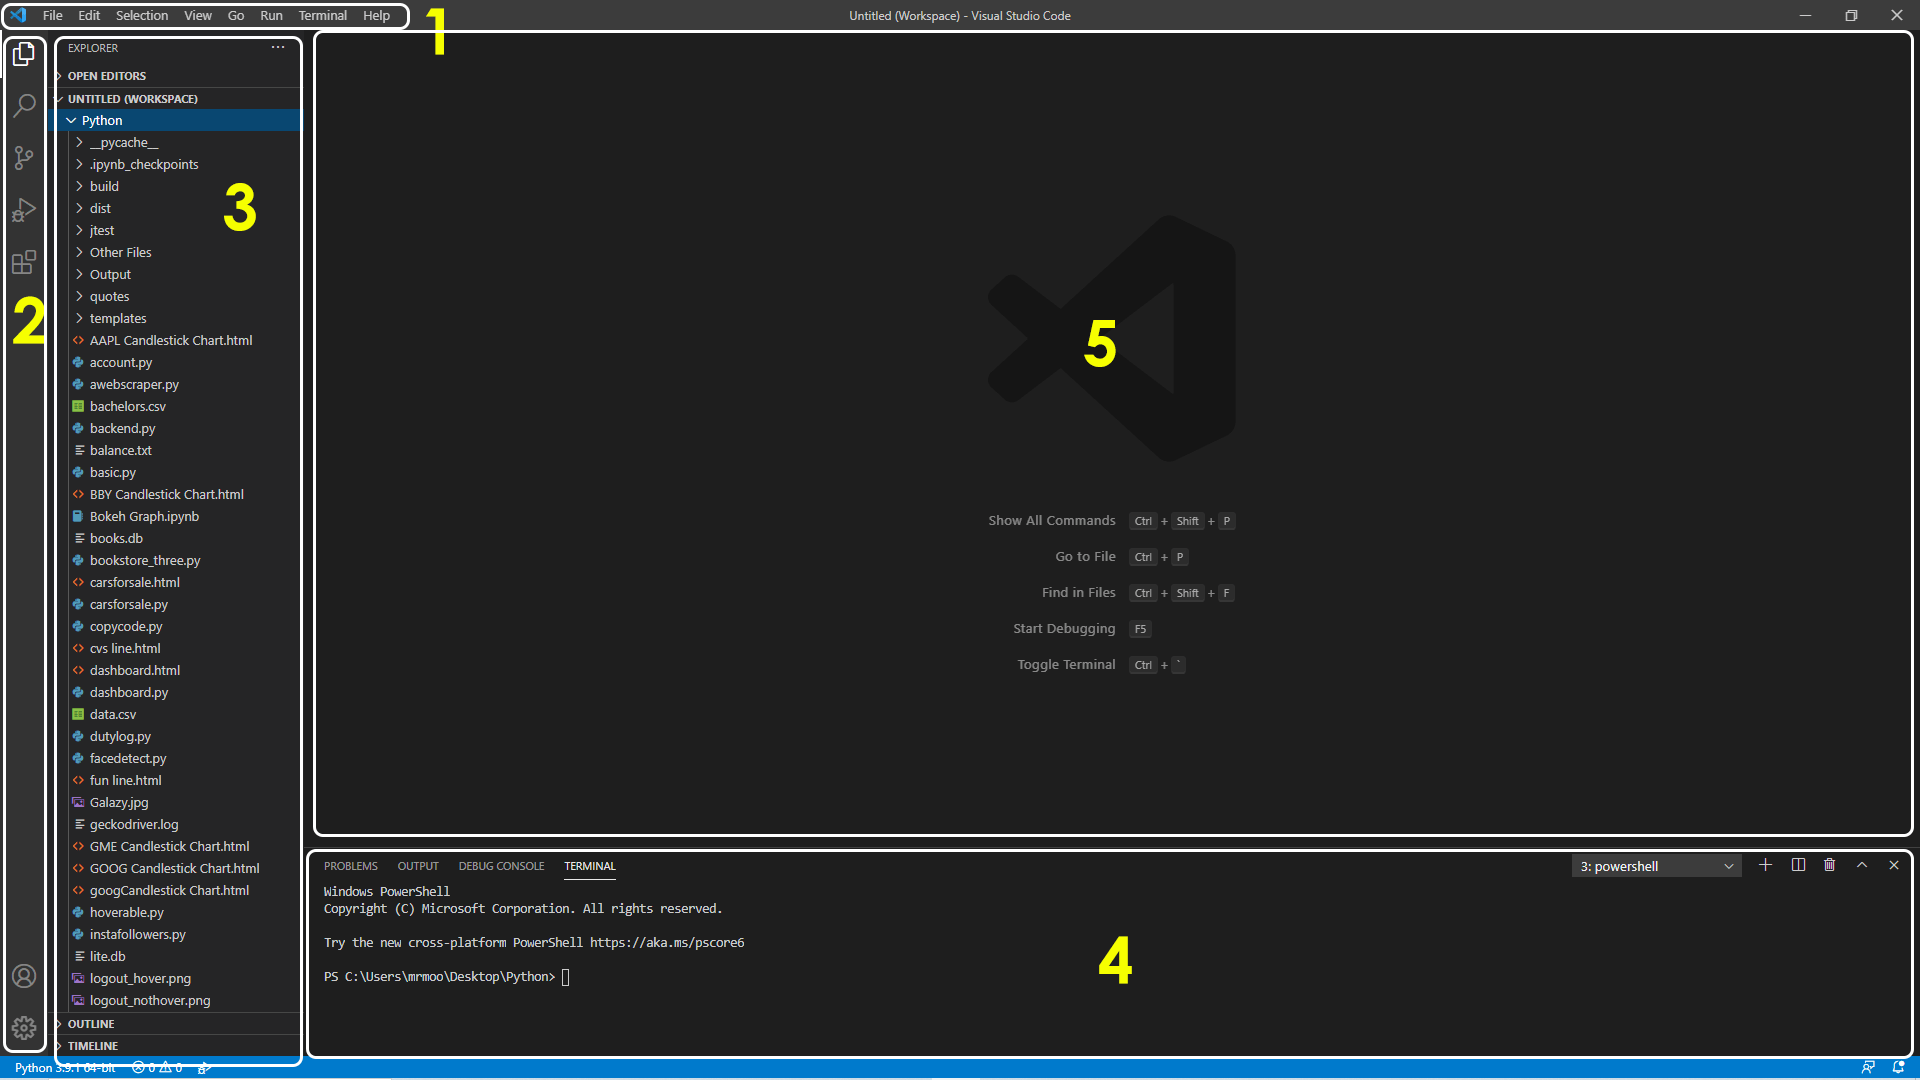
The primary workspace in VSCode is divided into five main sections, as noted by the numbers:
1. The menu bar
2. VSCode Sidebar
3. VSCode Explorer
4. Debug Console/Terminal
5. Document Display/Editor

Let’s start by looking at these sections in detail!
The menu bar
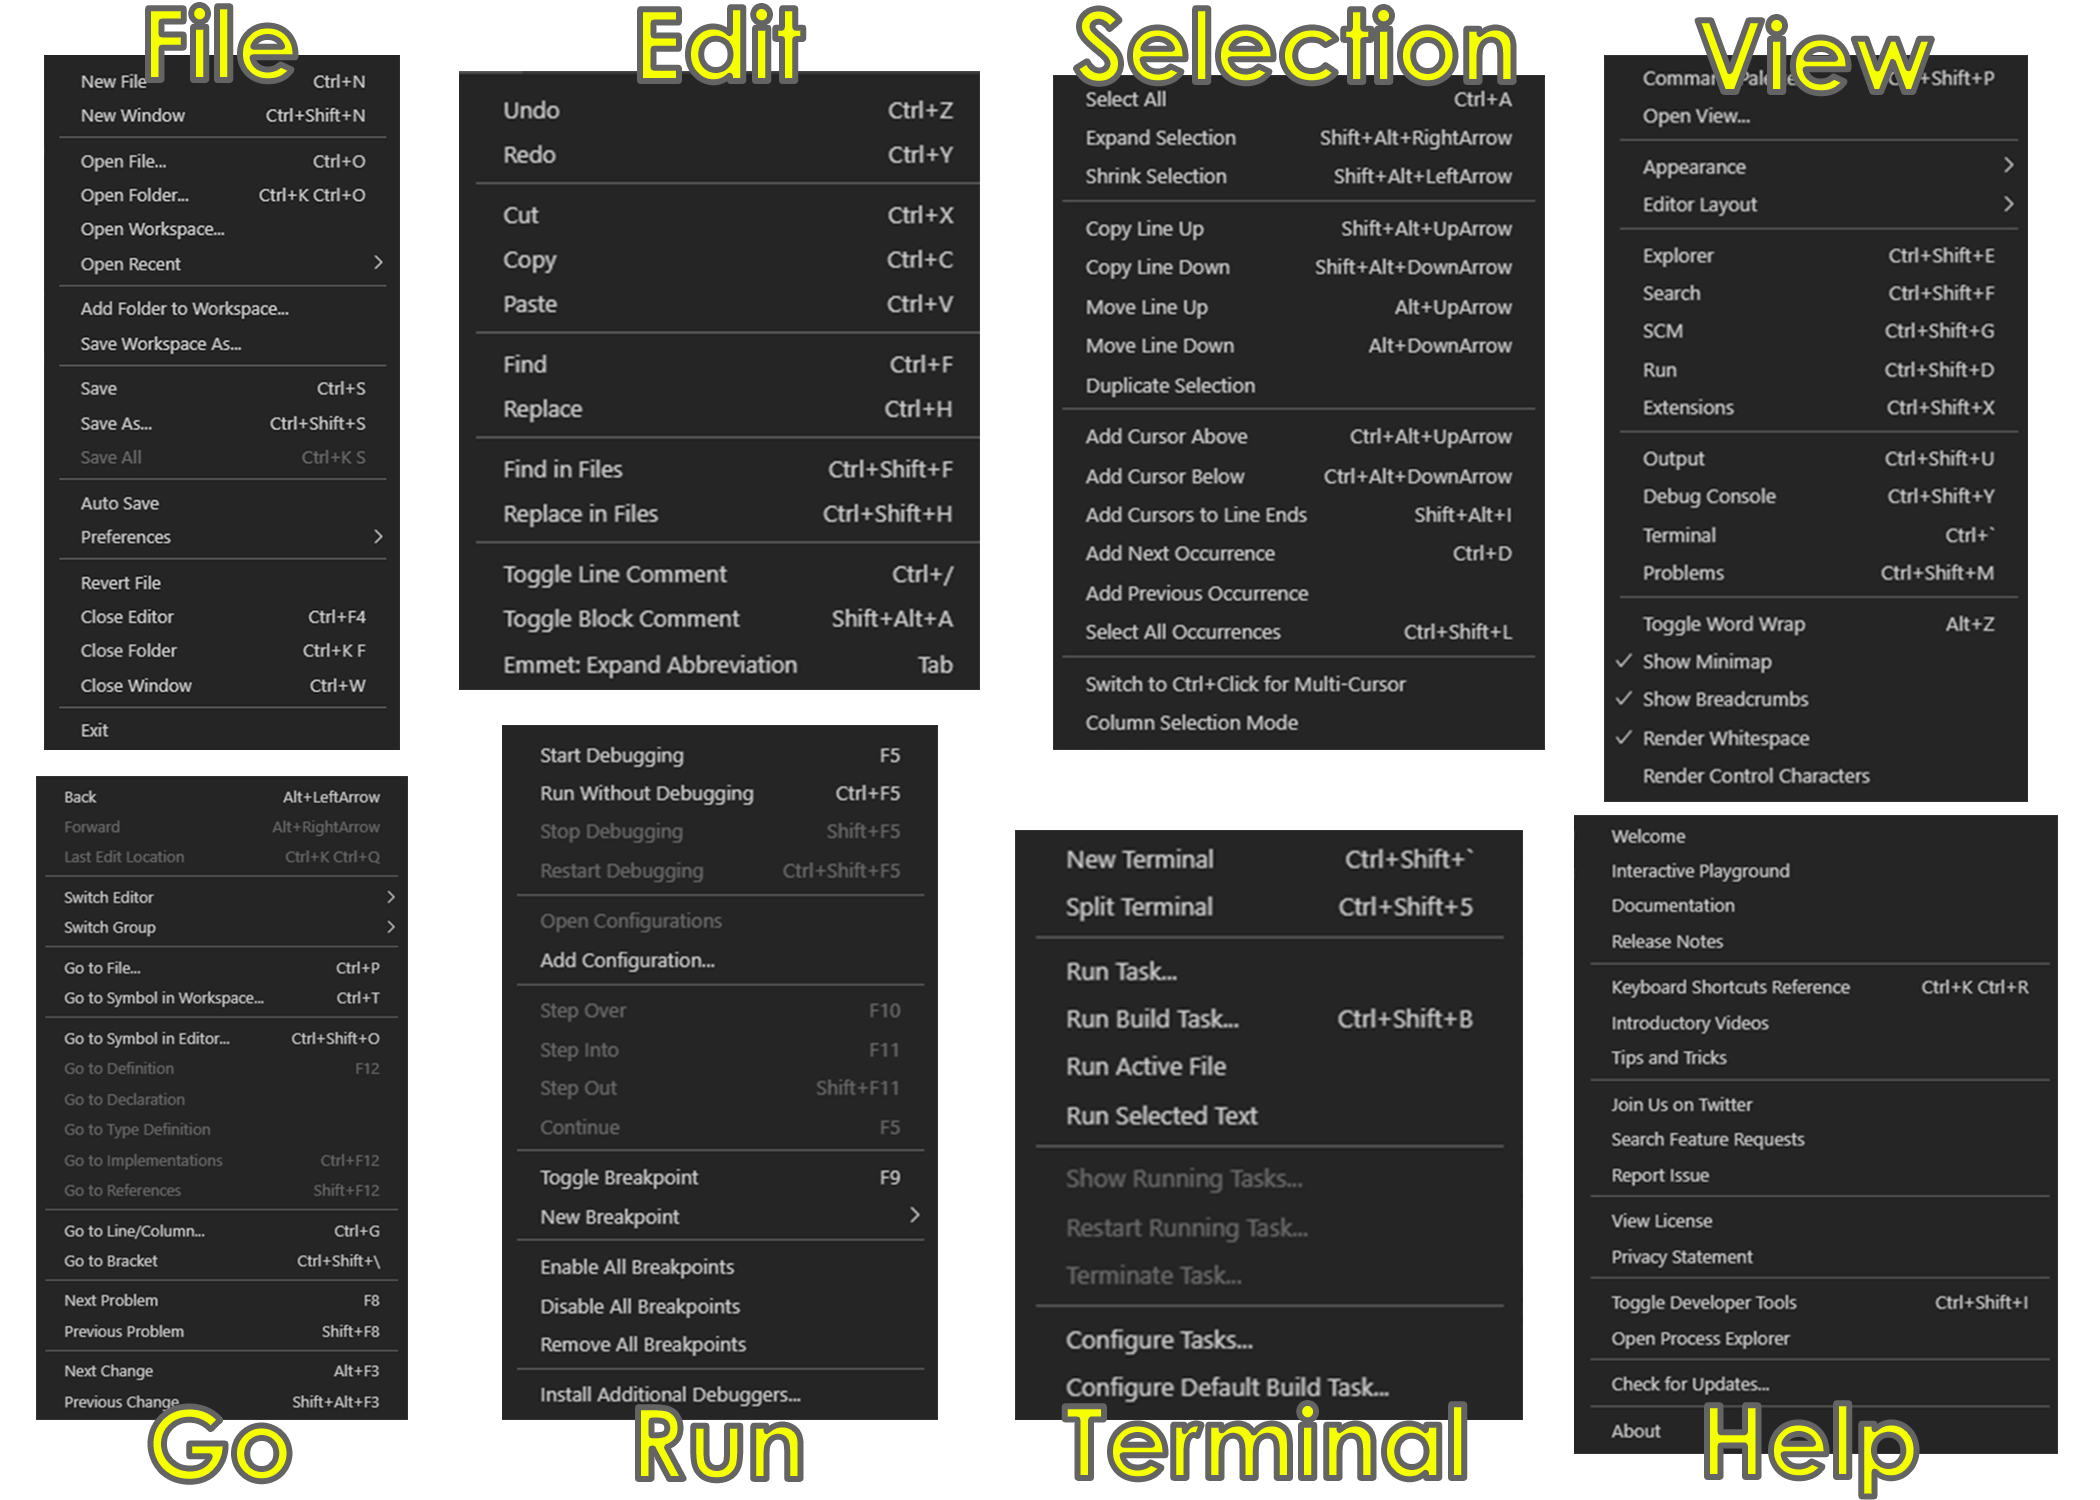
The menu bar is a no-frills part of the UI but vital to your projects.
- Under the “File” section, you can save and open projects, but you can add folders to your workspace as well.
- The “Edit” tab contains the standard copy/paste options, which come in handy when you need to make copies of a line with slight modifications. The find and replace options are hidden here as well.
- Under “Selection,” there are options that allow you to select and move through code easier.
- The “View” tab carries options that will enable you to change the look of VSCode and show windows such as a debug console.
- I don’t use “Go” as much, but this section again allows you to navigate code easier.
- The “Run” tab offers options to debug code and add configurations.
- The “Terminal” window lets you create a Terminal window and edit tasks.
- Our toolbox’s last tool is the “Help” window, which leads you to more information and documentation about VSCode.
The Sidebar
Looking closer at the sidebar, there are five main elements. The first is the “Explorer” tab, which I’ll go into in more detail later, but understand that it’s the meat and potatoes of organization in your workspace.
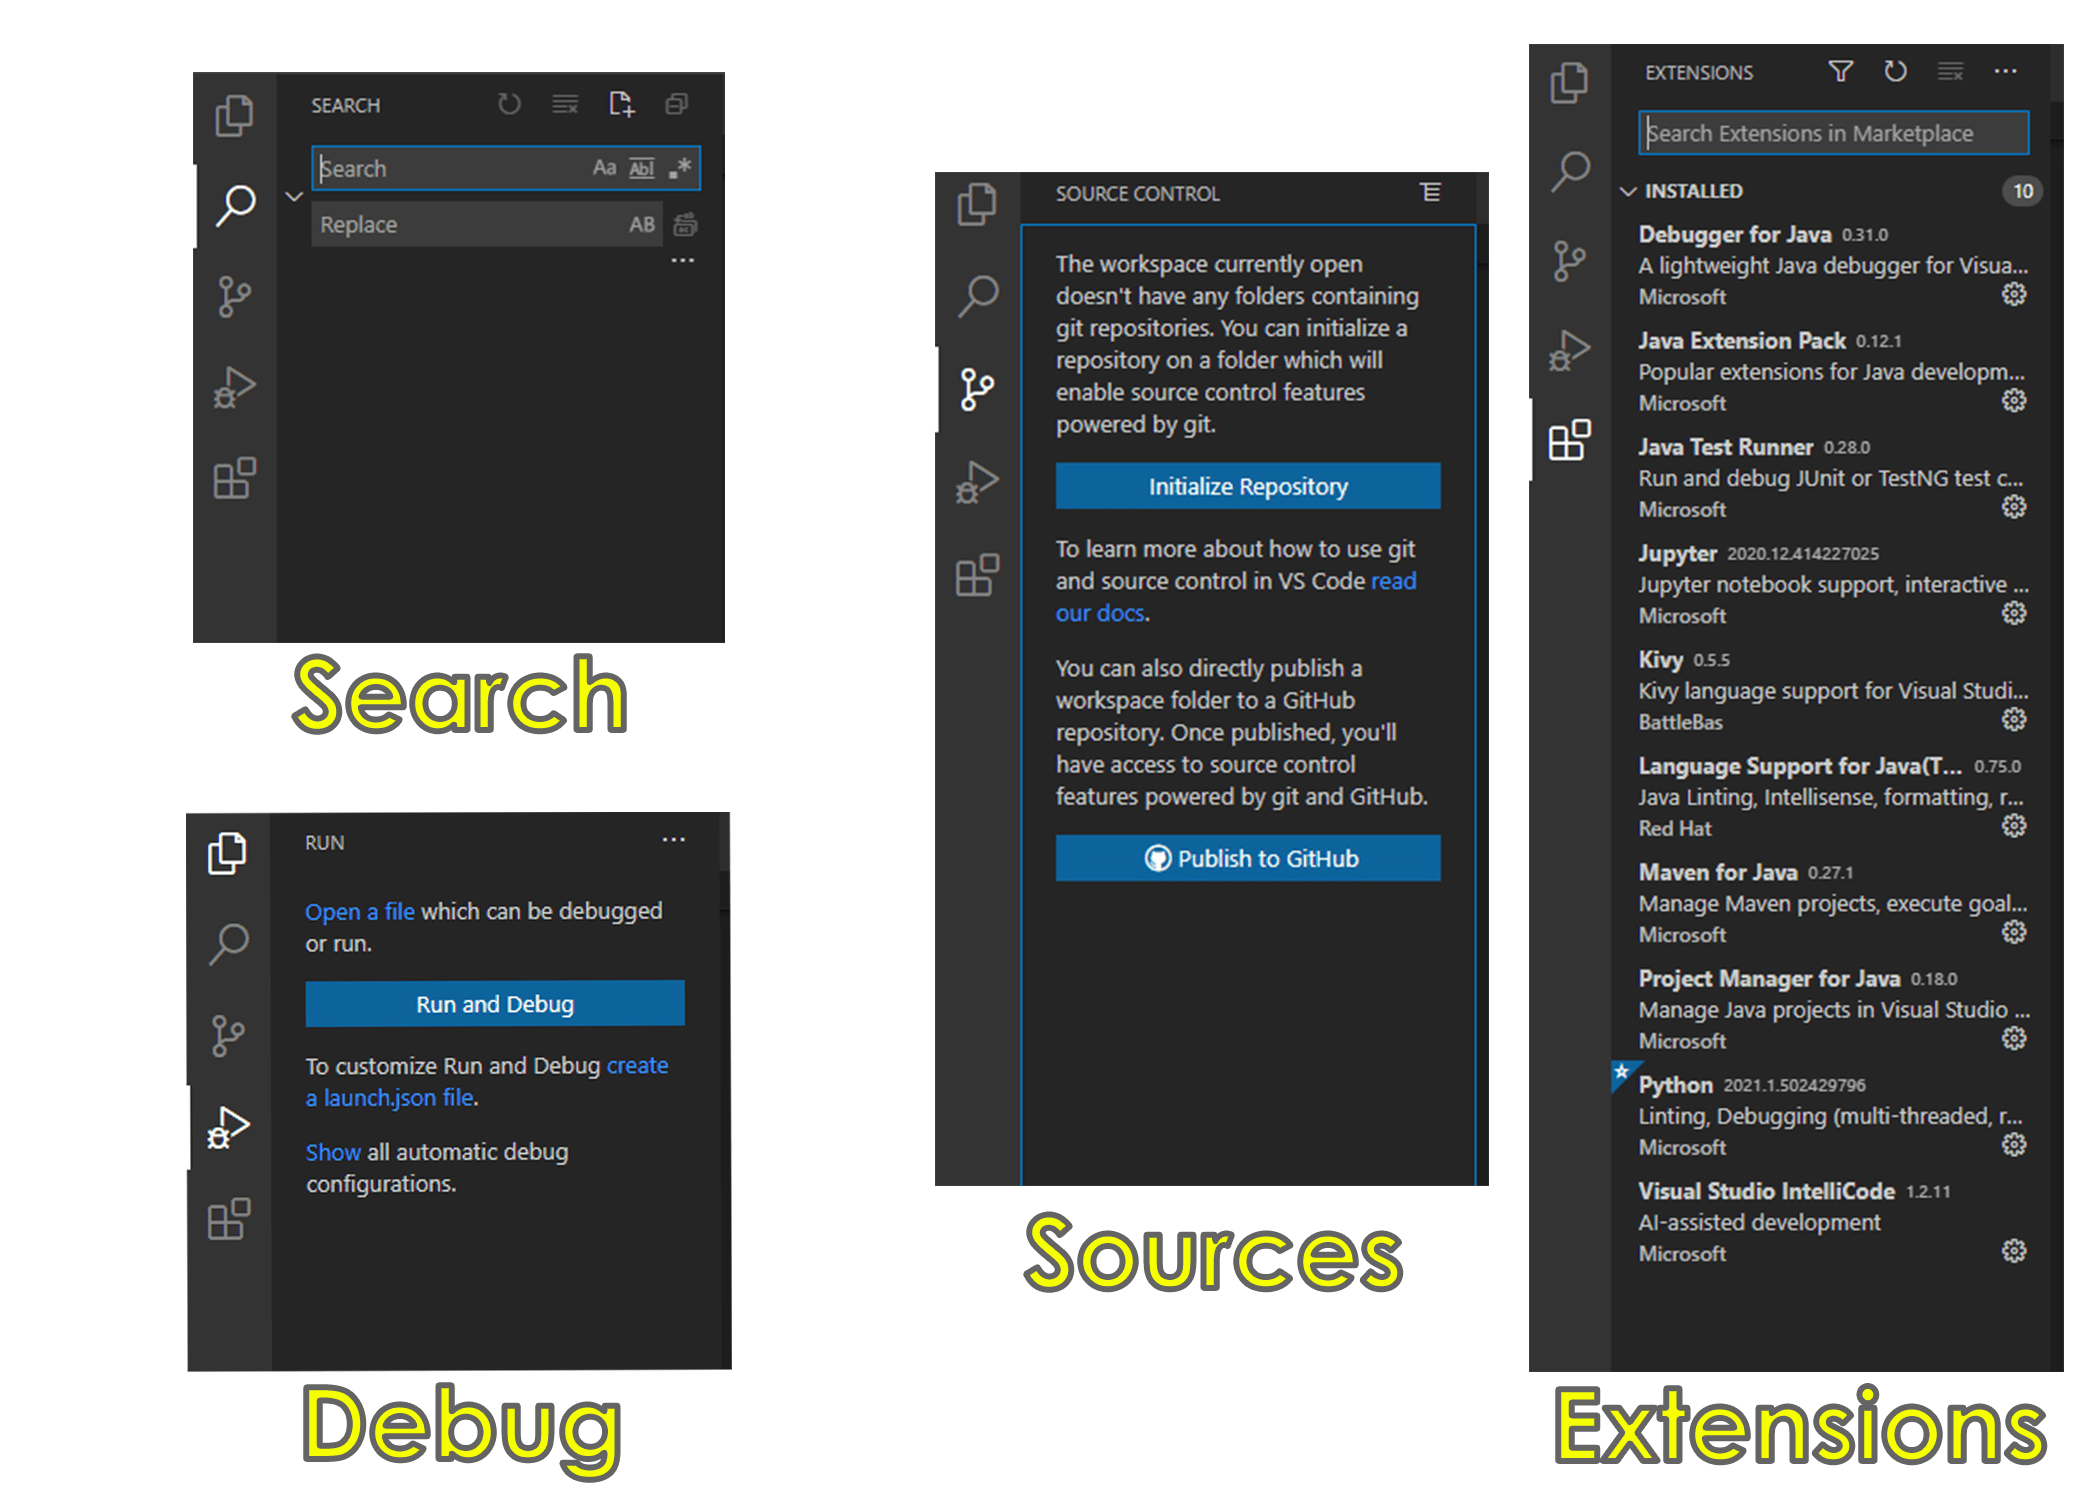
The “Search” tab is used to search for any string of characters. The best part is that any file in your workspace will be searched too, meaning that you can find specific text in all of your source code.
The “Source Control” tab allows you to publish and maintain code on the GitHub repository. This allows your code to be made public for other programmers to use and build their projects from. While an excellent feature for more seasoned programmers, you won’t need this if you are still learning VSCode.
The last tab, “Extensions,” allows you to see currently installed extensions and find others available to add. As you can see, I have a few installed for the Java and Python programming languages. If you haven’t done so already, make sure you have the essential VSCode extensions for Python installed.
Explorer
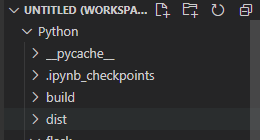
The explorer lets you create, organize, and delete files. You can create a new folder or refresh the directory using the tool buttons at the top. Any changes to your directory are almost instantly shown here, but you might need to force a refresh now and then. Furthermore, the explorer panel allows you to view things like a document outline (handy for large Markdown files, for example).
The last window icon allows you to minimize all folders at once. You will have to manage several files simultaneously as you build larger projects such as websites. This button clears the clutter and folds everything back into a simple view.
Skipping the first icon was no accident, as I wanted to show a cool feature in VSCode. This little icon lets you create a file in your current directory.
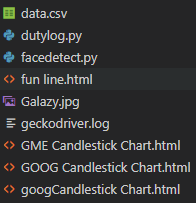
You can create many files that contain source code and will be recognized by VSCode. For example, the .csv file extension is typically used for storing comma-separated data. The .py files contain Python code, while the .html files are webpage files. My favorite part of this feature is the little icons it creates based on your file type. It gives you visual cues to quickly find what you’re looking for.
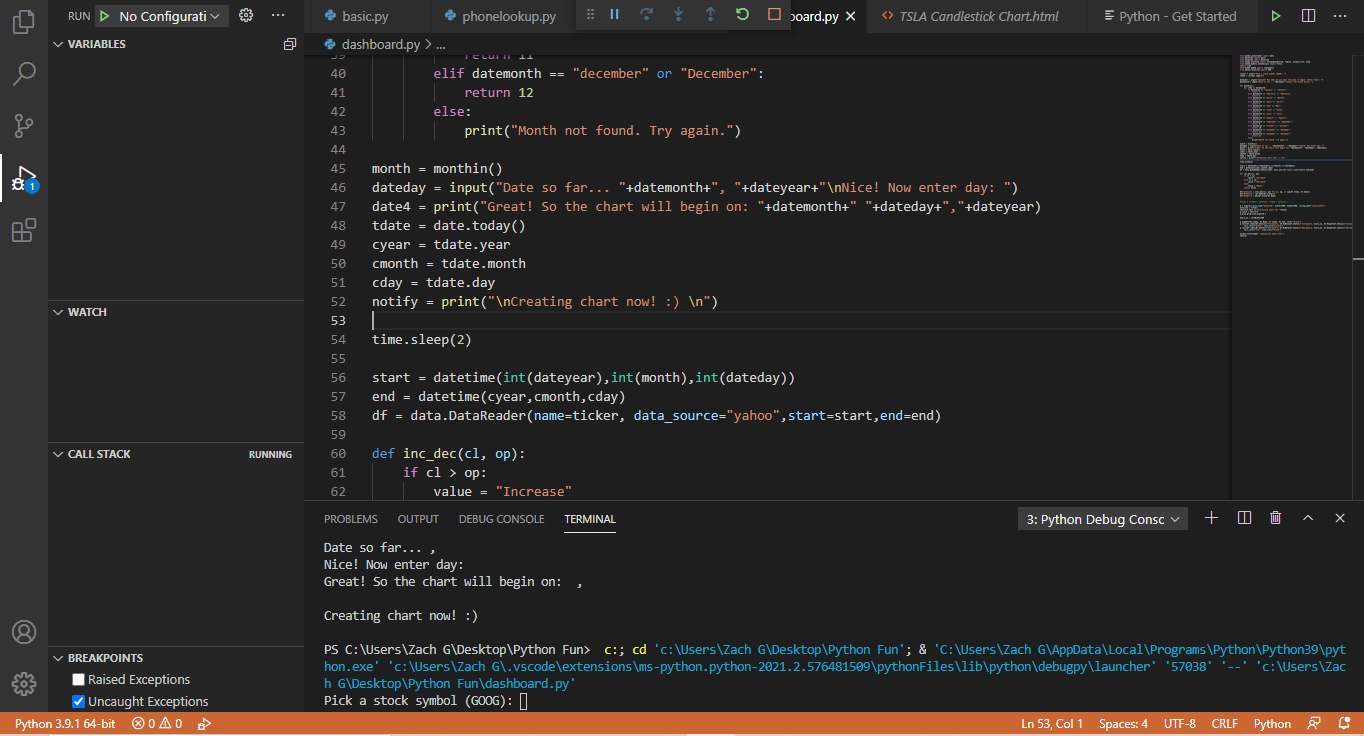
Debug Console and Terminal Window
The small bottom window is typically reserved for a Terminal window. Integrating a terminal in your workspace saves time and clicking. If you want to navigate through other directories or run a script, that’s typically done through the terminal, which is why it’s nice to have a nested window at the bottom.
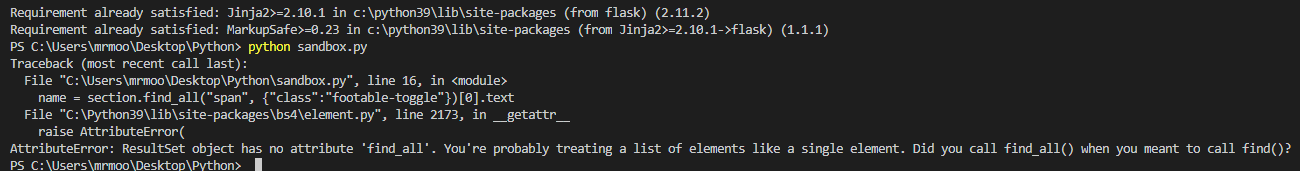
Running a script in VSCode is quite simple using the terminal. Let’s say you have a script called thisisavirus.py saved in your directory. If you want to run that, simply type python thisisavirus.py in the console.
You might want to run a python file in a different directory than your workspace is in. In this case, point the terminal to the file name and still use the python command as seen below. It’s important to use commas if the path has spaces in. This will prevent the error shown below from popping up.

The terminal is also fantastic to see where errors in your code might be, such as shown above. The traceback shows you what went wrong and where the code is that gave the error.
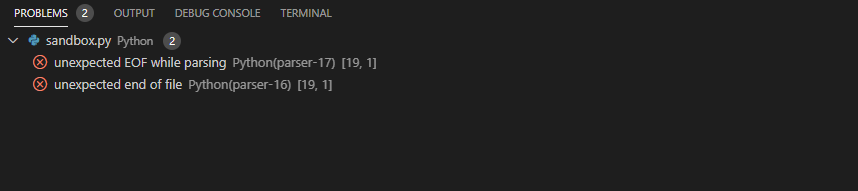
My favorite of the tools in this section is simply called “Problems.” It checks every open file in your workspace for errors and other problems. As seen here, I have an “EOF” error, which is simply a syntax error because of missing parentheses in the command print(name).
The Document Editor
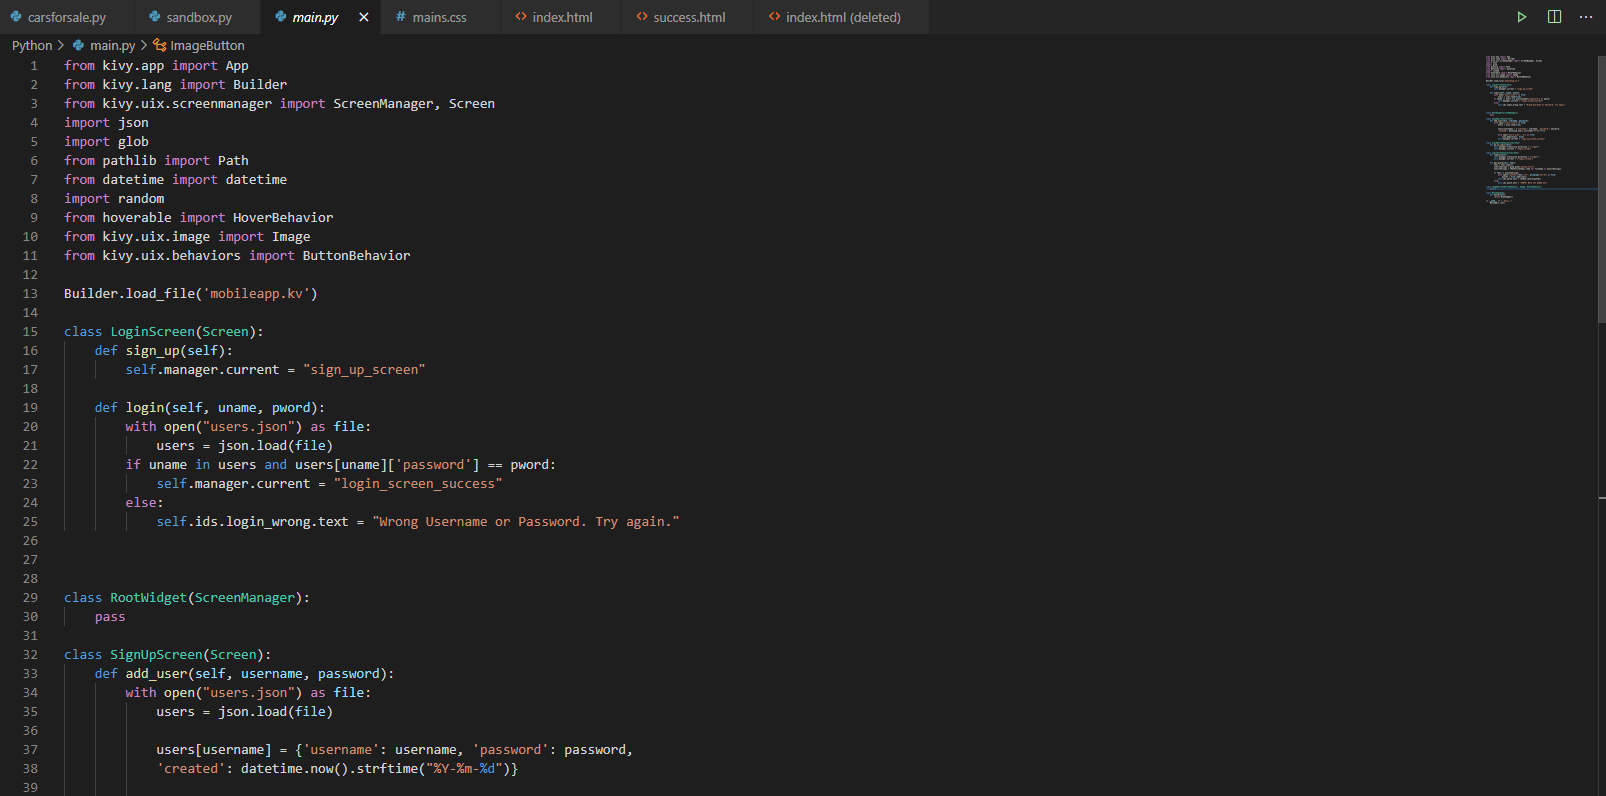
Look at all those pretty colors! In this code I built for a class, there are about six different colors, each representing another type of code. For example, purple text highlights native Python commands such as “import” and words found in loops. Strings will be highlighted orange to stand out from other text as well.
Another excellent feature of VSCode is the mini text overlay. When working with many lines of code, an error will inevitably pop up. Rather than scroll through hundreds of lines, VSCode provides you with a smaller version of your code on the right side, which will highlight a line in red if an error is spotted.
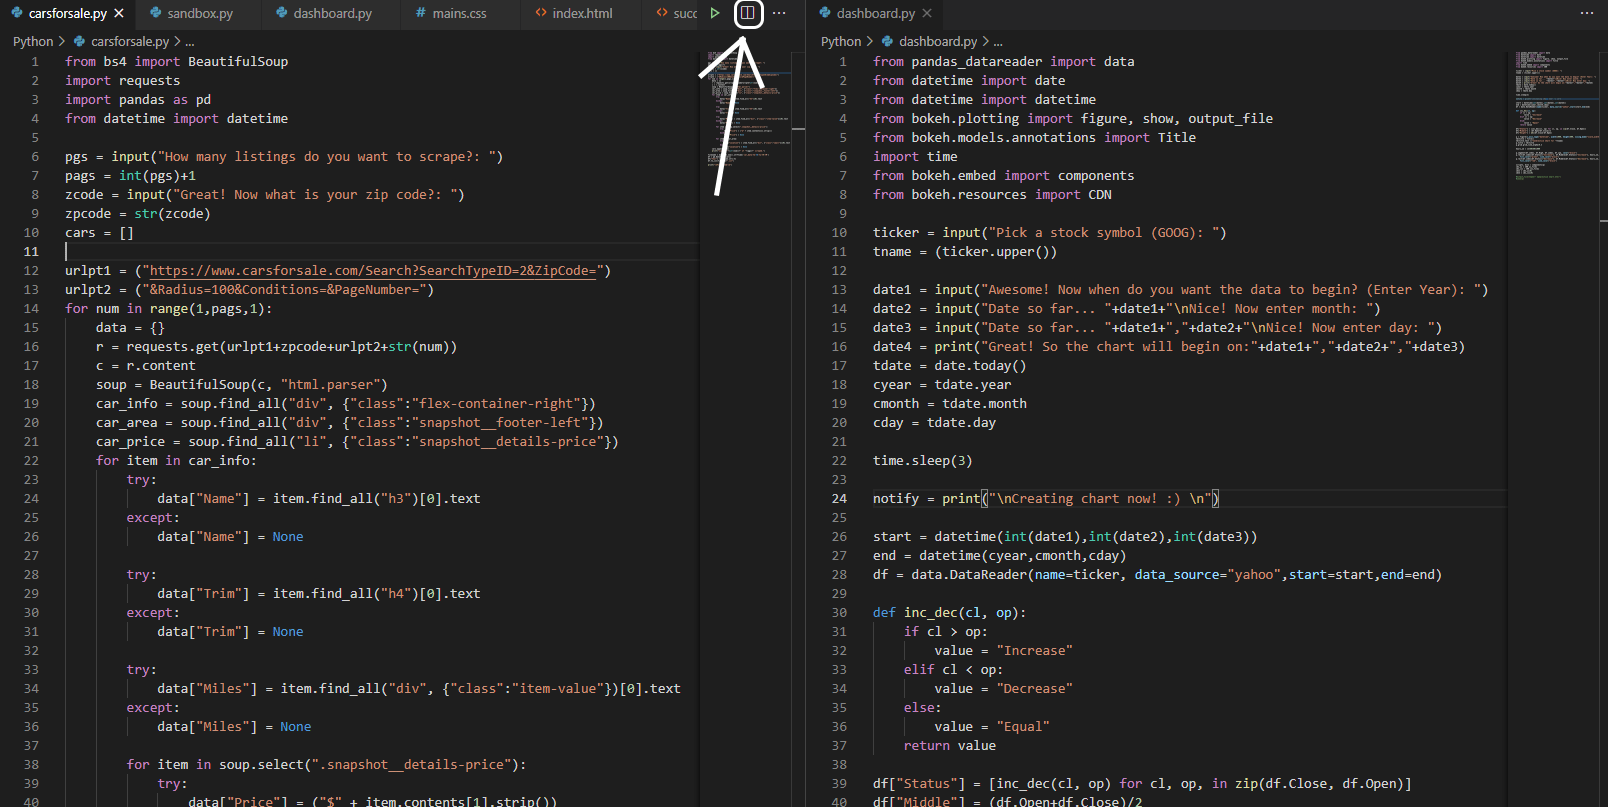
VSCode allows you to see multiple files by simply clicking on them and then clicking this little icon near the top. Each file is scrollable and dependent on the other file.
To the left of the dual-screen button is a tiny green arrow, which will run the code. More on this can be read in the next article on running and debugging your code in VSCode.
Finally, think of those people with ten browser tabs open at once. You may despise their ways, but VSCode sets no limit of open tabs either. This does come in handy now, knowing that you can split the screen and edit multiple files at once.
Finding and squashing bugs
We haven’t talked about the fourth icon yet. The play button, decorated with a little bug, runs your script in debug mode. When you enter debugging mode, the bottom of VSCode will turn orange. Your script is running in debug mode.
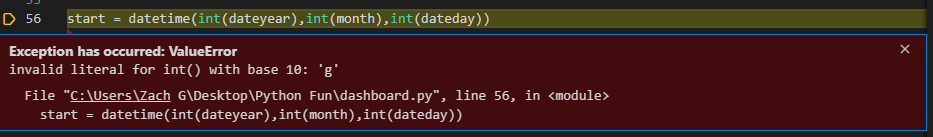
In debug mode, VSCode checks each line for errors as it runs. If a bug is found, you’ll be presented with this bright red window that points you to where the error occurred. This makes finding errors and debugging code much easier than depending on the terminal to tell you which line was at fault.
Debug mode also allows you to step through your code. This means running it line by line, stopping after each line. This gives you the opportunity to inspect the current state of variables and objects as your code is running. It’s a powerful way to squash those hard-to-find bugs and get a better understanding of what’s happening.
For a more thorough dive into running and debugging Python code in VSCode, just continue reading the next article.
Special thanks to Zach Goreczny for contributing to this article. Do you want to contribute to Python Land too? Please contact us.


Hi
“essential VSCode extensions for Python” – is this the same as “Python Extension Pack”?
Regards
Dave
No, I meant the extensions listed on the linked page. But the Python extension pack is certainly a good choice and includes those that I mention in the article (like Python Linter) and some that you might not need if you don’t do web development, like Django and Jinja.