
This article shows you how to use Python in VSCode. You learn how to run and debug your Python programs and how to leverage the command line inside VSCode to your advantage. If you followed the tutorial, you’ve already read a lot about IDEs and VSCode. If not, you might want to start with these pages:
- how to write a simple Python program with Notepad
- Why you should use an IDE for Python programming
- How to install VSCode
- Which VSCode Python extensions do you need for writing Python programs
- A tour of the VSCode GUI
Table of Contents
Create or open a Python project in VSCode
A VSCode window always shows one workspace. A workspace can, in turn, show multiple folders (or: projects) if you want it to. You can have multiple workspaces open, each in its own window. However, you’ll typically work on one project at a time. When doing so, one window with one workspace will suffice.
Creating a project is simple; it’s a directory that you open with VSCode. If you are on a terminal, and it doesn’t matter if this is on Linux, MacOS, or Windows, you can create a new project and open it with VSCode as follows:
$ mkdir myproject
$ cd myproject
$ code .Code language: Python (python)
The code command is a handy shortcut to open a VSCode window. If you prefer, you can also open the folder from the menu: File -> Open Folder.
If you define project-specific settings in VSCode, the IDE creates a new file, .vscode/settings.json, containing these project-specific settings. If you use a version control system, you may want to add the .vscode directory to the ignore list since your coworkers probably prefer other settings and preferences or even use a completely different IDE.
Run Python in VSCode
The following step-by-step guide helps you to set up VSCode correctly for running Python code.
Step 1: Select python interpreter
A system can have multiple Python interpreters. Using the right interpreter for your project is important since VSCode uses it to run and debug your code and provide things like auto-completion. VSCode usually does its best to detect the available Python interpreters automatically. VSCode even detects a virtualenv in your project folder, and this virtualenv also contains a Python interpreter, which VSCode can use. In addition, it also supports enhanced virtual environment managers such as Poetry and Pipenv.
Command palette
We’ll use a feature called the command palette to set the interpreter. The command palette gives you quick access to all functionality VSCode has to offer. It allows you to do almost everything with just your keyboard. It’s awesome and a real timesaver, so I suggest you get used to it early on.
The shortcut ‘Control + shift + P’ (Windows/Linux) or cmd + shift + P (MacOS) allows you to quickly open the command pallet. If there’s one shortcut you need to learn, it’s this one! Alternatively, you can use the menu: “View -> Command Pallet…“
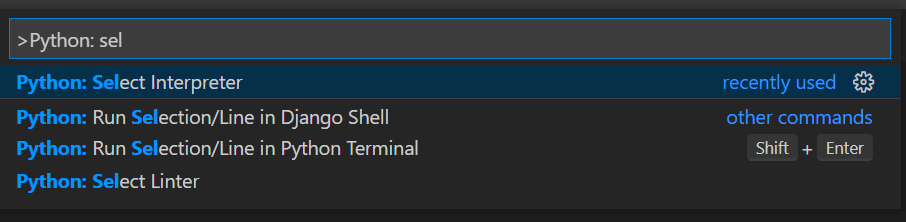
With the command palette open, start typing ‘Python: select interpreter.’ You’ll quickly see that the auto-complete helps you out; you don’t have to type the entire text:
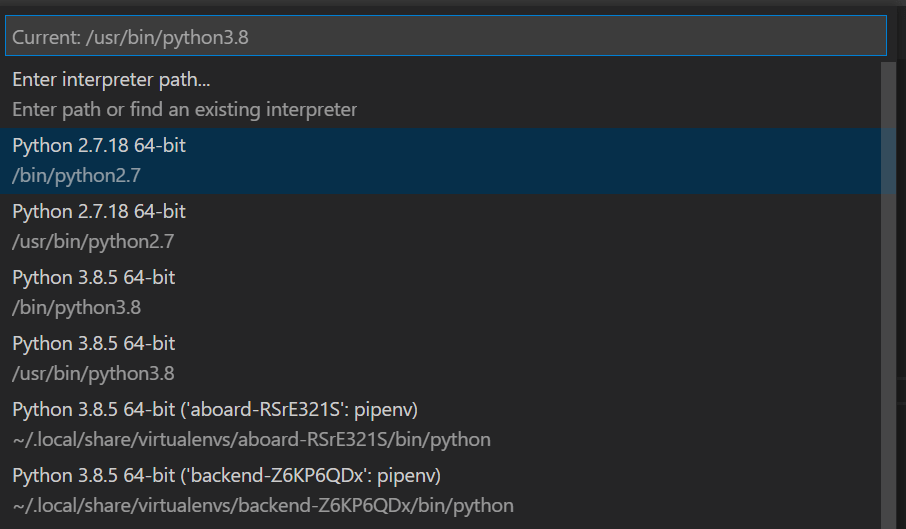
Preferably, you choose the interpreter from your virtual environment if you use one. If not, pick an appropriate version. If you don’t know which one to pick, choose Python 3 with the latest version.
If you don’t have any choice, make sure you have Python installed on your system and opt to enter the path to your interpreter manually. You shouldn’t have to; VSCode should be able to detect a correctly installed Python interpreter.
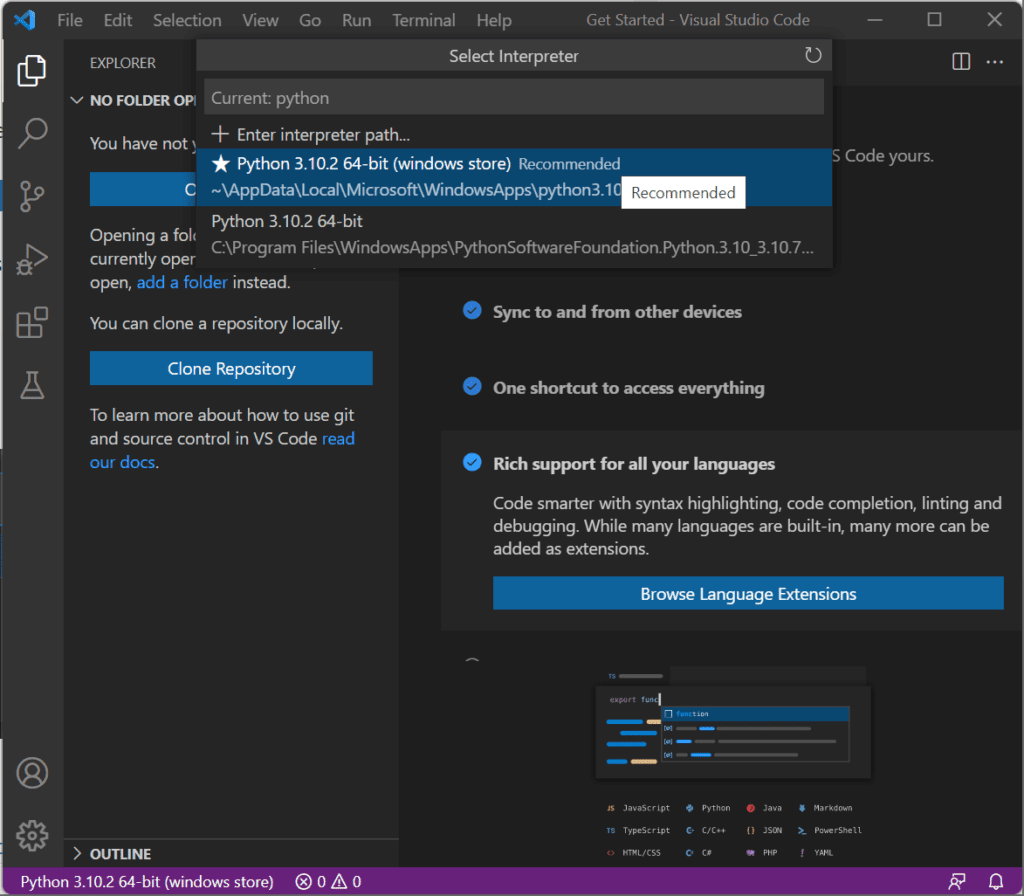
In Windows, this looks like this:
Step 2: Create a new Python project in VSCode
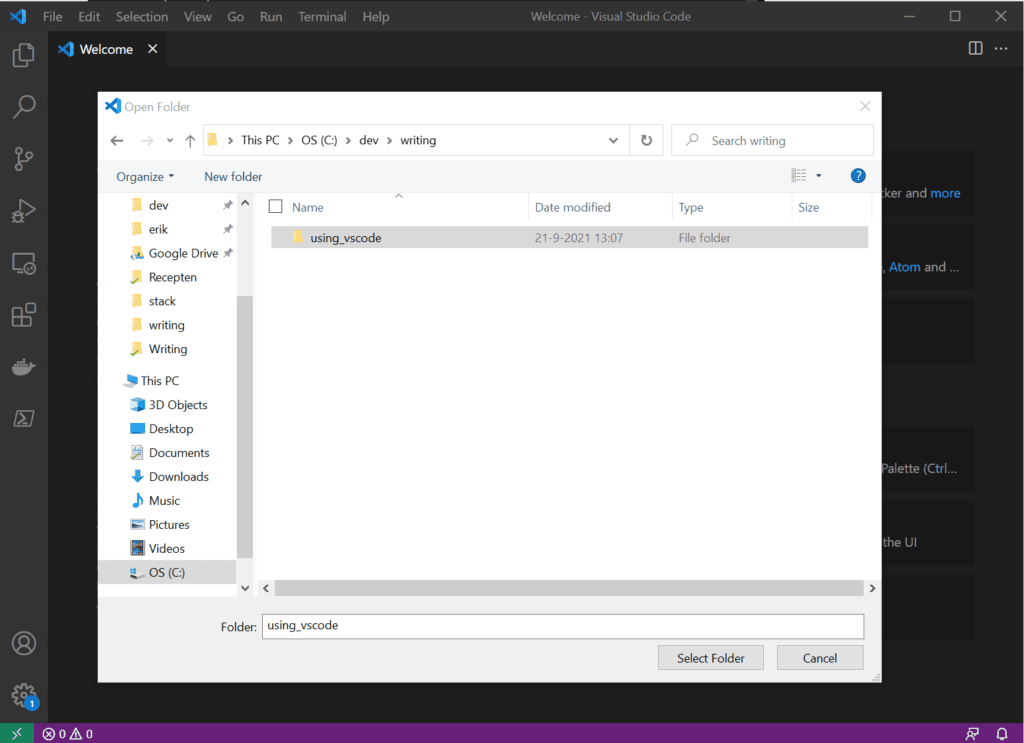
When you open VSCode for the first time, you’ll start with an empty workspace. Let’s open a folder in which we can start experimenting first. I created one beforehand, but you can use the ‘Open Folder’ dialog to create one in place too. How this works exactly differs per OS. In Windows, you can click ‘New folder,’ for example:
Step 3: Create and run a Python file in VSCode
With the interpreter configured, we can now run a Python program. Let’s create a simple program for testing purposes. Create a new file by clicking the ‘new file’ button in the explorer at the left or using the File menu. Call it anything you like; I called mine vscode_playground.py. If you haven’t already done so, VSCode might ask you to pick a Python interpreter at this point. Go ahead and pick one.
Copy and paste the following program into your newly created file:
import sys

if len(sys.argv) == 1:
    name = sys.argv[1]
else:
    name = 'stranger'

print(f'Hi there, {name}')Code language: Python (python)
This code will see if the script received an argument. If so, it assigns that to the name variable. If not, it will call you a stranger. I deliberately made a mistake that we will try to debug later on.
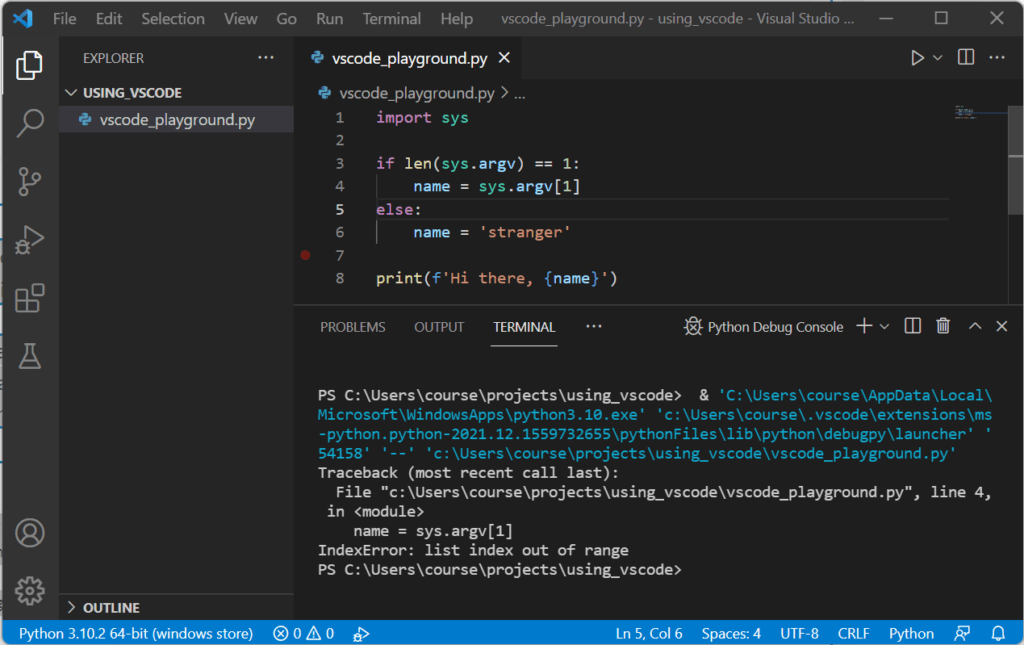
To run this file, you can either use the menu Run -> Run Without Debugging or press Control + F5 (Windows and Linux) or cmd + F5 (MacOS). What happens next is VSCode opening an integrated terminal window in which the file is run. Since we made a deliberate mistake, you should get an error similar to:
Traceback (most recent call last):
  File "vscode_playground.py", line 4, in <module>
    name = sys.argv[1]
IndexError: list index out of range</module>Code language: Python (python)
This is what this looks like on Windows:
Debug Python in VSCode
Debugging is one of those features that makes an IDE more powerful than a simple editor. It’s not hard to do and can save you many hours of frantically adding print statements to your code. So let us spend a little effort on learning the basics right now!
Debug current file
Instead of using the ‘Run Without Debugging’ option, we’ll now go for the ‘Run -> Start Debugging‘ option. Alternatively, you can simply press F5. VSCode will ask you what you want to do. Since we want to run the current file, pick ‘Python File’.
The program will again crash with an error. But instead of stopping, the debugger comes in and highlights the line in which the error occurred. Since it’s complaining about the list index being out of range, let’s inspect the sys.argv list more closely!
When hovering over the text sys.argv, you get a popover that allows you to inspect the variable in detail. When hovering over sys, you will see lots of internals from the sys module. When hovering over argv, you’ll see the contents of argv:
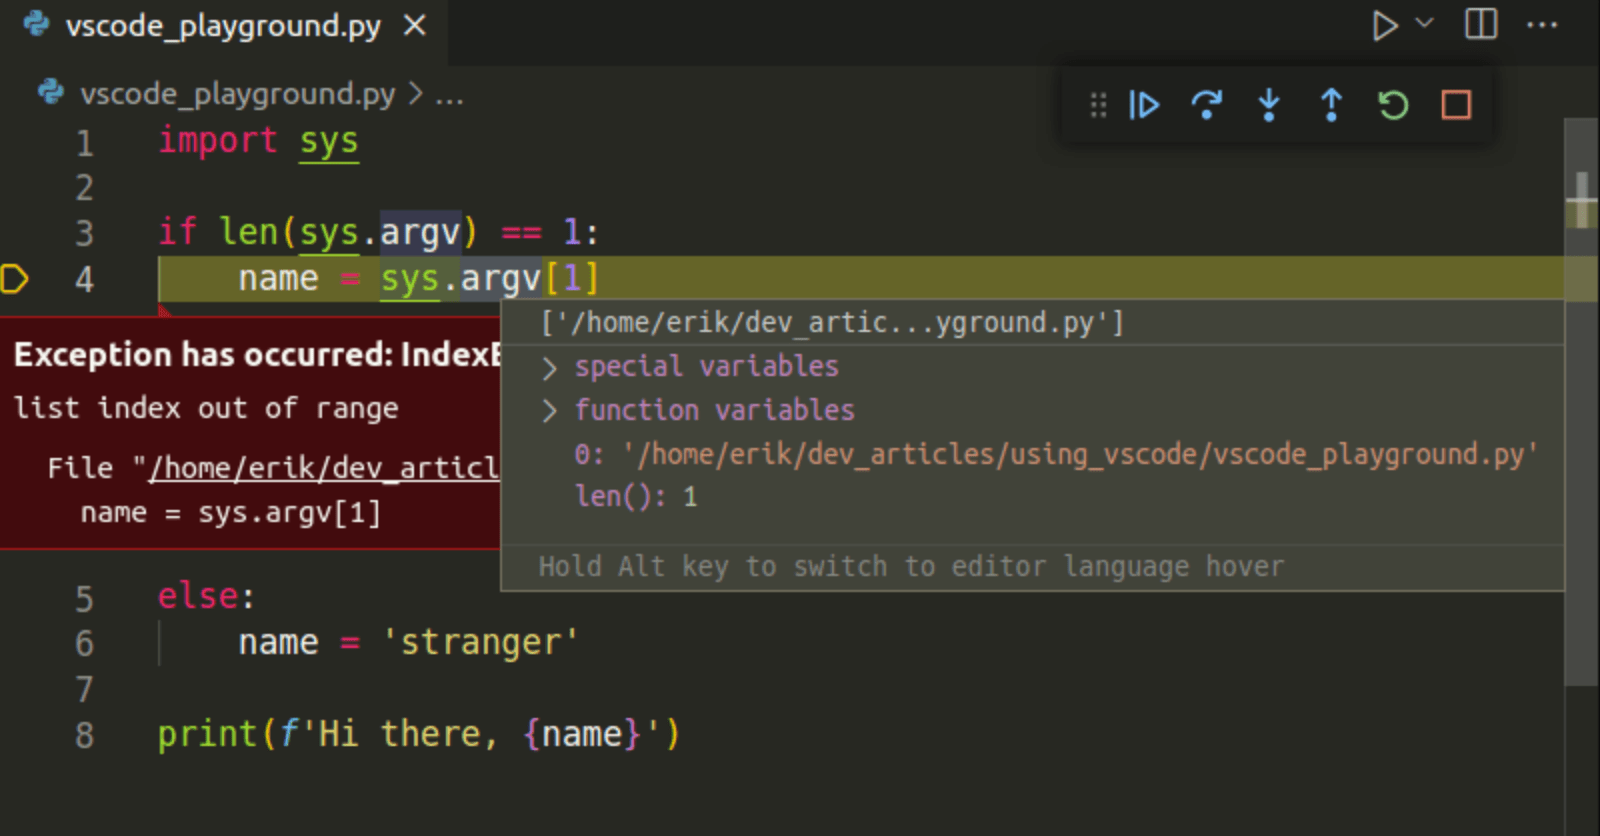
Even though we didn’t supply an argument, argv still contains one element: the complete path to the current script. Something we didn’t anticipate! The OS always gives us the program’s name as the first argument in argv. All we need to do now is change the comparison to: if len(sys.argv) == 2. Restart the program by pressing the restart button at the top right or by pressing Control + Shift + F5 or cmd + shift + F5. It should now output ‘Hi there, stranger’ and exit normally.
Create run configurations
You’ve learned a quick method to start debugging by running the current file. However, you can create one or more run configurations if you want more options. Such a configuration allows you to store specific parameters, so we can start the program exactly how we want it to.
To create a run configuration, click Run -> Add Configuration. Pick the ‘Python file’ option again. VSCode will create a launch.json file in the .vscode folder. This file is prefilled with an example configuration. Modify the JSON to look like this:
{
    "version": "0.2.0",
    "configurations": [
        {
            "name": "Run with argument",
            "type": "python",
            "request": "launch",
            "program": "vscode_playground.py",
            "console": "integratedTerminal",
            "args": ["Erik"]
        }
    ]
}Code language: JSON / JSON with Comments (json)
This configuration supplies an argument to the script: the name ‘Erik’. Note that it also specifically starts vscode_playground.py instead of the current file. You can now launch the debugger using this configuration. But first, let’s open the Run/Debug view in the panel on the left by clicking on the large run button with the little bug on it or clicking Ctrl+Shift+D or Cmd+Shift+D:
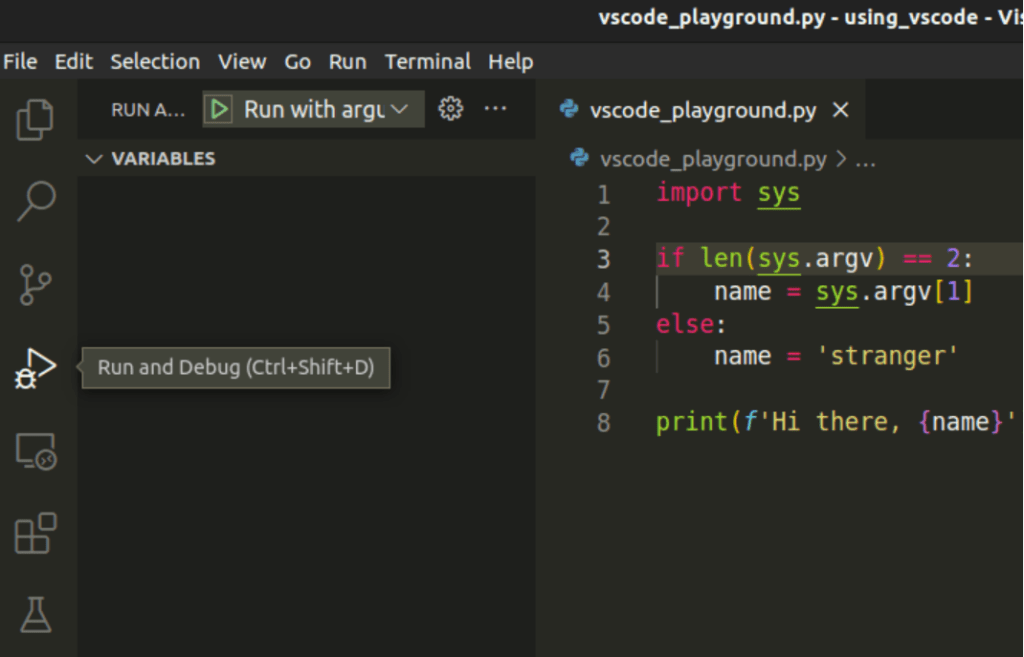
At the top of this view, you should see your newly created configuration. Start it by clicking on the play button next to it. The output should now say ‘Hi there, Erik’.
Breakpoints
At some point, you want to use breakpoints: a line in your program at which you want to explicitly pause the execution, or take a break, so you get a chance to inspect the state of your program at that point. Adding a breakpoint is extremely easy. In the left margin is an area that is often called the gutter. This is the space on the left side of a file where the line numbers are displayed. A faint red dot should appear when you hover there with your mouse, and it will turn bright red once you click it:
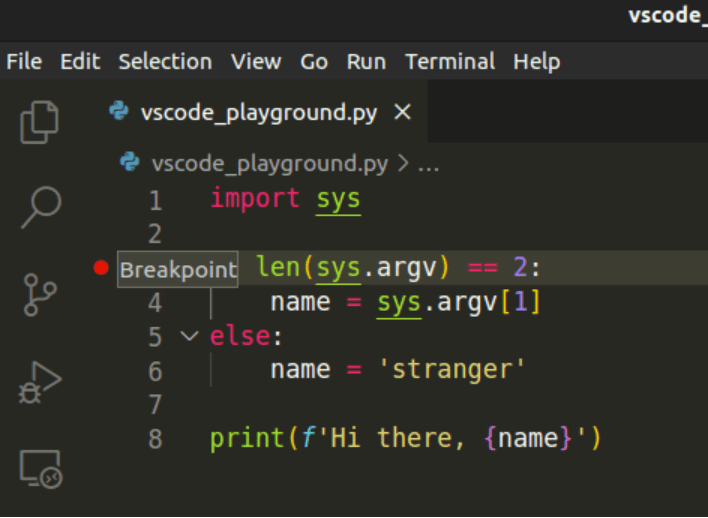
If you run the program now, it will pause on the breakpoint, allowing you to inspect the variables at that point in time. To continue, you can click the continue button or press F5. The debugger will continue execution until it encounters another breakpoint or the program finishes.
Alternatively, you can execute the program step by step from here on by using the step over (F10), step into (F11), and step out (F12) buttons. This way, you can execute the program line by line and optionally step into and out of Python function calls.
A few short notes on these step types:
- Step over: run the command on this line. If it is a function call, run the entire function instead of ‘stepping in’ and running the function line-by-line.
- Stepping in: follow (or step into) a function call and run that function line-by-line.
- Step out: run the function to the end, and return to the point right after it was called.
You now have a solid base level of knowledge to start debugging in VSCode. For more details, I’d like to refer you to the debugging section of the VSCode documentation, which should be an excellent continuation of what I’ve taught you so far.
Run selection or current line
Another helpful feature is the ability to run a code selection or the current line you’re on. This won’t always be useful: often, a line of code or selection of code heavily depends on its context. But sometimes, it can come in handy. To run a code selection or the current line, press Shift+Enter or use the command palette and search for ‘run selection in terminal’.
The code runs in a Python REPL, and once finished, this REPL stays open so you can experiment, inspect variables, etc. For example, if you ‘run’ a function, you can now call that function from the REPL since it is defined there.
A cool feature is that all subsequent commands to run a selection or current line are executed in this same REPL, keeping the state intact. So if you change the function and ‘run’ it again, the function gets redefined in the REPL. It’s a nice hack to test the code you just wrote, but it’s not a replacement for proper unit testing.
Running code from the terminal
VSCode has an integrated terminal, which can be extremely useful. Some people never use it, and others use it all the time. I’m part of that last group: I run my code from the command line unless I’m debugging. I also do version control on the command line. I find it very useful to be familiar with all the command-line tools. It allows me to perform crucial tasks without an IDE, e.g., on someone else’s PC, a remote terminal, or just a quickly opened terminal window instead of opening a complete IDE.
Besides my personal preference, there are several use cases in which it’s easier to use the terminal instead of the GUI. For example: when you are testing with command-line options. You can add options in a run profile, but using the terminal is quicker if those options constantly change.
So let’s also explore how to run your code from the integrated terminal window.
Step 1: Open the built-in terminal
Use the Command Palette to run Terminal: Create New Terminal, or use the shortcut Ctrl+Shift+` (that’s a backtick). A terminal should open at the bottom of your screen. By pressing that key combination again, you can create more terminal windows. You can quickly show and hide the terminal panel by pressing Ctrl+` repeatedly.
Step 2: Run your code
Don’t forget to activate your virtual environment if you have one. Next, run your Python file as you would with any other file:
$ python3 vscode_playground.py Erik
Hi there, ErikCode language: Bash (bash)
VSCode and Python Virtualenv
When using a Python virtual environment, you need to let VSCode know. As mentioned earlier, the way to do this is to select the interpreter from your virtual environment instead of the system-wide one.
To test this, let’s create a virtual environment first:
python3 -m venv venv
As you can see from the screenshot, VSCode almost instantly noticed that we created this venv and offers to use it:
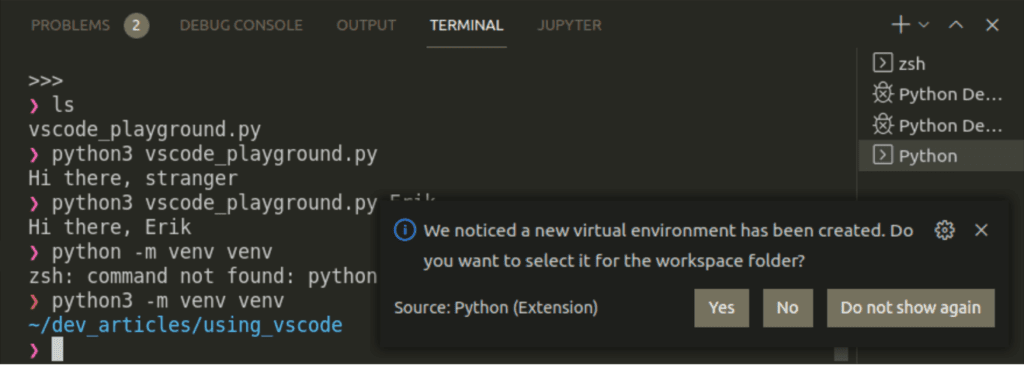
Click yes, and you’re done! Alternatively, you can manually select this venv in the command palette (Ctrl+Shift+P) by typing ‘select interpreter’ and clicking on ‘Python: select interpreter.’
Formatting Python in VSCode
You can format Python in VSCode if you hit:
- Windows: Shift + alt + F
- Mac: Shift + Option + F
- Linux: Ctrl+Shift+I (that’s an uppercase i).
- Or open the command palette (ctrl + shift + p) and start typing ‘format document’.
VSCode, by default, formats the current document. If you haven’t done so, it asks you if you want to install a formatter like autopep8, black, or yapf. Pick one (the default, if you are unsure), and let it install.
From now on, if you press the format shortcut while editing a Python file, you’ll notice that your file gets formatted according to the default rules of the formatter. If you want to customize these rules, you will need to look up (e.g., on Google) how to do that for the specific formatter you picked. Usually, you can add or modify rules by creating a specific file in your project’s main directory.
Saving a workspace
Finally, you might want to save your workspace. It’s not necessary, though. You can simply open the folder again. Customizations like your launch configurations are kept in the (hidden) .vscode directory, and VSCode will find this if you open the folder. However, if you opened multiple folders in your workspace and don’t want to repeat those steps continually, you can save the workspace using the File -> Save Workspace As.. menu.
Keep learning
Read these articles to learn more about Visual Studio Code and its features:
- Installing Python properly
- Why you should use an IDE for Python programming
- How to install VSCode
- A tour of the VSCode GUI
- VSCode Python extensions
The following external link might be helpful too:

fyi, for those who can’t find python extension, make sure you installed visual studio code, visual studio is something else.. also, make sure python itself is installed on your pc.
Hi Erik,
First of all, thank you soooo much for setting up this course. It has been a godsend. It is so much easier to learn Python with your tutorials than anything else that I have found.
But I am having a problem with this one that no one else seems to have. For the very first part of this tutorial, I am getting a syntax error message for the “sys” portion of “import sys”. I am including the code so you know what I am talking about. I have no idea why it is giving me this error. Please help. I can only think that it needs to be defined somehow, but I’m not sure how. When I hover over “sys’, I get a message that says “statements must be separated by new lines or semicolons”. Underneath that, it says “‘sys’ is not defined.” Please help.
Here is the code that I am talking about:
import sys <- THIS IS WHERE I AM GETTING THE ERROR
if len(sys.argv) == 1:
name = sys.argv[1]
else:
name = 'stranger'
print(f'Hi there, {name}')
sorry about the uppercase… I'm not yelling, I just wanted it to be different from the code 🙂
Hi there,
While it may be a late reply, I noticed in your code that “sys.argv” has an uppercase “S”. It should be lowercase, as in “sys.argv”.
Hi Erik,
great course so far, thanks!
However I got stuck in the “Create run configurations” section. When doing Run > Add Configuration I don’t see the ‘Python File’ option.
I’m on Windows and I’ve installed the latest Python version 3.11 + the Python extensions that you suggested.
Would you please “open on my eyes” and help see the ‘Python File’ option?
Please tell me, what *do* you see in that case? The only thing I can think of, is that there’s already a run configuration. In this case, the launch.json file is opened directly. Could that be it?
I have the same problem as Sara: No python option. I see a bunch of options in a popup list, none of them are Python. For example: “AWS SAM: API Gatewya lambda invoke”
I’ve been running and debugging python in this copy of vscode for months. But now that I want to change a debugger option, there seems to be no way to do it.
vscode version 1.76
Erik,
I ran into this same issue in v1.78.2 with python 3.11.3 as my interpreter. It opens the settings.json file and the intellisense options that pop up are options to attach it to different browsers. If I don’t select them, I see the following starting with Line 1
{ "files.exclude": { "**/__pycache__/**": true, "**/**/*.pyc": true }, "python.formatting.provider": "black", "workbench.colorTheme": "Default Light Modern", "launch": { "configurations": [ ] } }Code language: Python (python)Update on my previous post today.
It appears my user error was not creating my new folder in the default .vscode location. I had changed it to a different server folder.
When I created it in the default location, then click on Add Configuration, I may choose the python file option and the launch.json pops open to allow me to proceed correctly.
I am working through the tutorials and so far they are great for me. One note: This section:
Step 2: run your code
Don’t forget to activate your virtual environment if you have one. Next, run your Python file as you would with any other file:
$ python3 vscode_playground.py Erik
Hi there, Erik
The code didn’t work, giving a Permission Denied error. (I am using windows 10 and bash on VS code). Doing some googling, the answer was instead of calling python3… I needed to call py… I don’t know why/what is the difference, but this works.
Thanks. I need to make this more clear throughout the tutorial. On Windows, you can use the py command which is a launcher that picks the right version of Python. On most Linux distributions you use python3 or sometimes python.
In my case (windows user) it was the $ that was the problem. This didn’t seem to be needed and when I removed it everything else worked fine.